
Analysis of Fulham Town Centre
Points of Interest
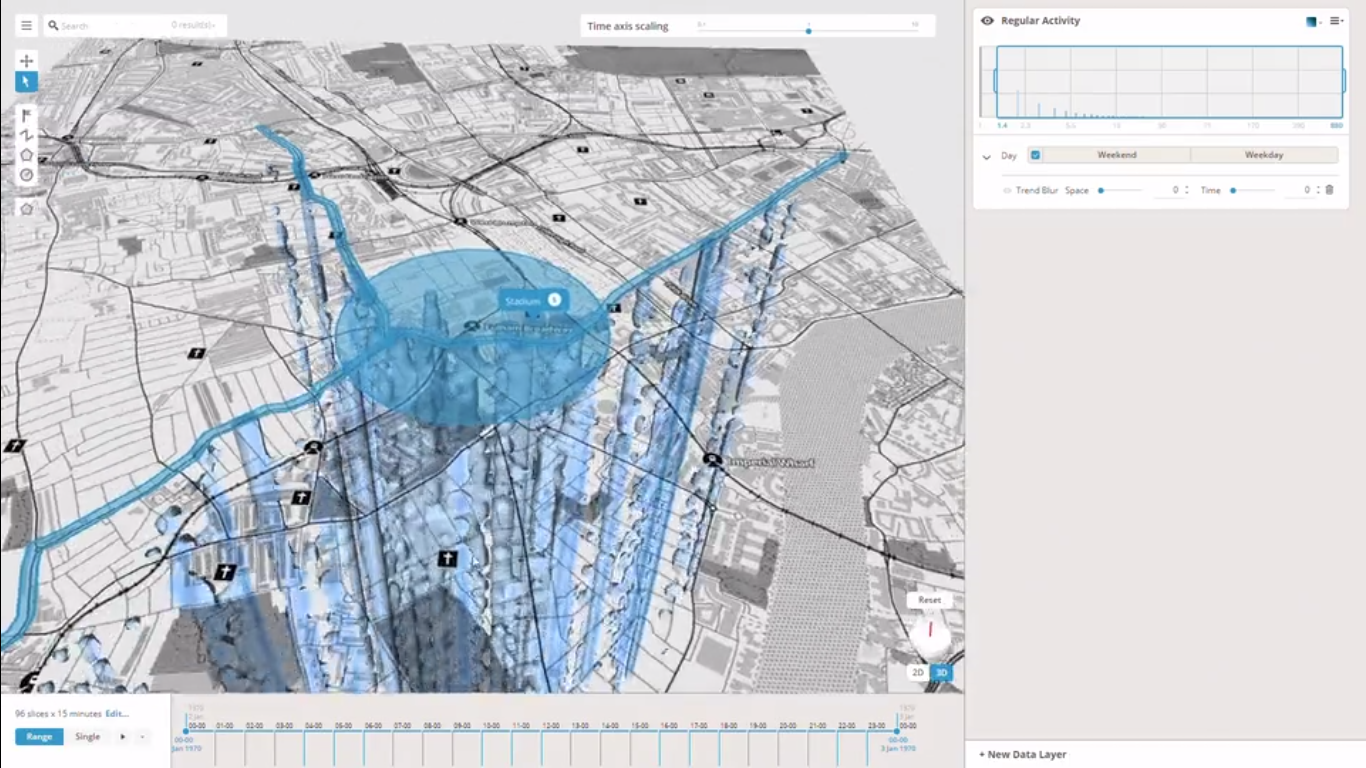
Smart Urban Management (SUM) works with both owners of key tourist and visitor sites and business owners nearby looking to capitalise on the increased footfall.
We can help theatres, shopping centres, museums, stadiums, and other key points of interest understand their visitor base and guide them on how to further increase revenue.
By conducting studies on movement patterns within sites we can highlight dead spaces within venues and map out preferred routes within the site. A comprehensive analysis of visitors can derive insights on origins of visitors, including country of origin for foreign tourists, preferred routes to site, and spend data.
Similarly, we can help nearby businesses understand the visitor base to the POI to enable them to adapt their offer and have more targeted marketing campaigns.
Please see our project on Stamford Bridge Stadium here.
Data Analytics & Metrics
Big data analytics is driven by the application of various metrics to support the decision making progress of stakeholders. These metrics help urban practitioners to make informed, accurate and sustainable decisions. Smart Urban Management (SUM) data sets include:
- Cellular data
- Social Media data including Twitter
- Open source - public data sets (CENSUS etc.)
- Travel data
- Card transactions
Depending on the focus and outputs of the projects, SUM is able to collect and process extensive information and granular details on the following metrics:

Movement
- Mobility patterns – directional footfall numbers, desired paths etc.
- - Origin and destination area of visitors
- - Transport modes (public, private, cycling, walking etc.)
- - Distance and time travelled
- - Dwell time
- - Patterns around ‘points of interest’
- - Congestion and bottlenecks
- - Hotspots of activity
- - Under-used areas and times
- - Key transit places
- - Catchment areas – (origin of visitors)

Behaviour
- Socio-demographics (ethnic origin, social - status etc.)
- - Discussion topics – around events, incidents, points of interest etc.
- - Sentiments analysis
- - Semantic links – identify competing places
- - Security perceptions

Economics
- Transaction Volume
- - Commercial diversity (sector break up etc.)
- - Business hours
- - Commercial real estate rents
- - Commercial capacity – bench-marking sentiments against transaction volumes
- - Spend satisfaction
These metrics do not include those that can be measured using existing data sets urban practitioners may already possess such as those related to licensing, planning, enforcement, crime etc. New data can be analysed together with existing data to identify bespoke places and the relationship patterns occurring within the urban realm.
SUM is pioneering the application of big data analytics to place making. For further information please get in touch using the get in touch tab at the top or the email address below.